Phase rule, construction of state diagrams. Phase p - V and t - s state diagrams P t x v state diagrams
7.2.1 Phase p – t diagram... When considering the individual phases of a pure substance, they usually mean its aggregate states: solid, liquid and gaseous... However, in the general case, the concept of "phase" is somewhat broader than the concept of "state of aggregation", since some substances in the solid state, for example, ice, carbon, can have several phases.
Phase transition, i.e. transition of a substance from one phase to another, accompanied by a change in the properties of a substance, the release or absorption of heat (heat of phase transition). Equilibrium coexistence of several phases is possible only for certain combinations of state parameters (for example, temperature and pressure). Knowing the conditions for the equilibrium coexistence of different phases is important for solving many technical problems, for example. to determine the conditions for boiling liquids in hydraulic systems, to assess the conditions for the occurrence of cavitation in pumps, etc.
The analysis of the conditions of thermodynamic equilibrium of phases is based on the Gibbs phase rule.It establishes a relationship between the number of independent state parameters (degrees of freedom of the system) ψ, number of phases k and the number of system components n... Mathematically, the Gibbs Phase Rule is formulated as follows:
ψ \u003d n - k + 2.
For pure substance (one-component system n \u003d1) the Gibbs phase rule has the form:
ψ \u003d 3 - k.
In this case, a single-phase system (solid, liquid, or gas) has two degrees of freedom, i.e. two independent state parameters. This means that if you arbitrarily set two state parameters (for example, p and t), then all others will be uniquely determined. At the same time, this means that in a single-phase state, a substance can exist with arbitrary combinations p and t.
Two-phase system ( k\u003d 2) has only one degree of freedom ( ψ \u003d 1); here only one state parameter can be arbitrarily set. Therefore, the equilibrium coexistence of two phases (solid and liquid, liquid and gaseous, solid and gaseous) is possible only for a certain combination of values p and t;those. every value pcorresponds to a well-defined temperature at which the coexistence of phases is possible.
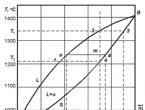
On fig. 7.2 depicts a typical phase p– t diagram with lines of phase equilibrium. Here AK is the line of phase equilibrium of liquid and gas (vapor), АС - solid and liquid; AB - line of solid state and gas. In other words: AK is the vaporization (condensation) line, AC is the melting (solidification) line, AB is the sublimation (desublimation) line. The AK line is also called the saturation line, which ends critical point K... Three lines intersect at one point A, which is called triple point... At this point, there are three phases simultaneously, because according to the Gibbs phase rule at k \u003d 3, the number of degrees of freedom of a one-component system is zero ( ψ \u003d 0). For example, for water at a triple point p A = 616 Pa, t A \u003d 0.01 ° C, and for carbon dioxide p A \u003d 0.518 MPa, t A \u003d - 56.7 ° C.
Using the phase diagram, it is possible to establish in what state (solid, liquid, gaseous, two- or three-phase) a particular substance will be at given values p and t... In addition, the phase diagram can be used to determine the phase transition temperature at a given pressure and vice versa.
The phase diagram also establishes the nature of the transition of a substance from one state to another. For example, for p 1 > p A the transition from a solid state to a gaseous state occurs through a liquid state. Under pressure p 2< p А the existence of a substance in a liquid state is impossible; here the solid phase turns into gaseous, bypassing the liquid stage. At the same time, at pressures exceeding the pressure at the critical point, the coexistence of the gaseous and liquid phases is impossible, and at temperatures exceeding the temperature at the critical point (see below), the substance exists only in the gaseous (vapor) phase.
7.2.2 Phase p - v diagram... Processes of changing the parameters of a real gas during a phase transition liquid-vapor most clearly can be represented using p–v diagrams ( fig. 7.3).
In this diagram, the region of equilibrium of two phases ("liquid - vapor") is depicted not by a line, but occupies a certain area. Three areas can be distinguished here: I - liquid state, II - two-phase state (phase equilibrium "liquid-vapor") and III - gaseous (vaporous) state. The MK curve is the locus of points that determine the state of a liquid heated to boiling point (saturation) at an appropriate pressure. It separates the liquid region from the saturated vapor region and is called the liquid boundary curve (here x = 0).
The points of the NK curve determine the state dry saturated steam. This curve separates the saturated vapor region from the superheated vapor region and is called boundary curve steam; here x \u003d 1.0. On p-v diagram in the two-phase state, lines of constant steam dryness are plotted ( x 1 ; x 2, etc.). With an increase in pressure and, accordingly, the temperature at which the phase transition occurs, the specific volume of the boiling liquid increases, and the specific volume of saturated vapor decreases. At a certain pressure, quite definite for each substance, the boundary curves converge to the point TO, which is called critical point.
On fig. 7.3 several isotherms ( T \u003d const)... It is seen that in the region of the superheated state, the isotherm has a form close to that of an ideal gas. In the region of the two-phase state of matter (“liquid – vapor”), the isotherm is simultaneously an isobar. This directly follows from the Gibbs phase rule, according to which a two-phase one-component system has only one degree of freedom. In the region of the liquid state, an increase in pressure leads to an insignificant change in the volume of the liquid due to its low compressibility. At a critical temperature, the horizontal section turns into a point (critical point), which is an inflection point on this isotherm. The state of matter at this point is characterized by critical parameters: pressure r k, temperature T to and specific volume v j. The critical parameters of some substances are given in table 7.1.
Table 7.1 Critical parameters of some substances
Critical point Kbelongs simultaneously to both boundary curves and corresponds to the state of matter in which there is no difference between liquid and vapor. This is illustrated by the dependence of the heat of vaporization on temperature for water ( fig. 7.4), from which it can be seen that at the critical point the heat of vaporization becomes zero ( r\u003d 0). At temperatures above the critical value, the isotherms have no horizontal sections. At these temperatures, for any pressure, the substance is in a vaporous (gaseous) state, and the form of isotherms with an increase in temperature approaches the isotherms of an ideal gas.
Of p– vthe diagram follows an important conclusion about the different nature of the transition of liquid to vapor at different pressures. At subcritical pressures, when heat is supplied to the liquid, the liquid is heated to the boiling point, vaporization, during which the substance is in a two-phase state, and steam overheat occur. At supercritical pressures (line x - y) the transition from a liquid to a gaseous state occurs continuously, bypassing the two-phase state. In this case, the boundary between liquid and gaseous phases is arbitrary.
When a liquid passes into vapor at subcritical pressures, an abrupt change in the properties of a substance occurs. As follows from fig. 7.5, which shows the dependence of the density of hydrogen on temperature at two pressures, at supercritical pressure this process proceeds with a continuous accumulation of differences between liquid and vapor. This should be borne in mind when designing and analyzing the operation of technical devices in which phase transitions are possible (heat exchangers, cooling systems, refrigeration units, steam generators of power and power plants).
Using the critical parameters of a substance, one can determine the constants a and bin the van der Waltz equation: a \u003d27 R 2 T 2 k / 64 P k , b \u003dR T k / 8 P k , R \u003d8 P k v k / 3 T k. The parameters of a substance referred to the corresponding parameters in a critical state are called given parameters:
Here p k, T k - critical values \u200b\u200bof pressure and temperature of a given substance. Using the given parameters, the van der Waals equation can be written in the following form, which is called the reduced van der Waals equation of state. For all substances at the critical point, the given parameters have the same value equal to unity.
For practical calculations with an error of 15%, the equation of state of a real gas can be used in the following form:
p υ \u003d z ∙ R ∙ T,(7.2)
which is derived from the law of corresponding states... Here z- coefficient of compressibility, depending on pressure pand temperature T and determined experimentally. Based on the analysis of experimental data, it was found that, with a certain accuracy, the function z \u003d z (π, τ) is universal, i.e. common enough for different substances. For a specific substance, it can be determined from z -π chart in fig. 7.6.
Attitude z k \u003d R T k / p kv kat the critical point is called critical coefficient and taking into account the above relations for the critical parameters ( a, b, R) is constant and equal to 8/3 \u003d 2.67.
Next in a row, we will analyze the phase equilibrium diagram with limited solubility of the components in the solid state and eutectic transformation... In eutectic systems, the introduction of the first amounts of one of the components to the other causes a decrease in the temperature of the alloy, so that the liquidus curve passes through a temperature minimum called the eutectic point. Liquid has solubility in any proportion, and solubility in the solid state is limited.
As a result of the eutectic transformation, crystals of very small size are formed, which are indistinguishable in an optical microscope. For this reason, different phase components that are formed as a result of the transformation are combined into one structural component.
An example of a phase diagram with eutectic transformation is shown in the figure. The α and β phases are solid solutions. The phrase "limited solid solutions" is applicable to these solutions, because the region of stability of each of the solutions extends only to a part of the diagram. These phases can also be called primary solid solutions, since the regions corresponding to them start from the edges of the diagram (inside it), and are not limited on both sides somewhere in the middle of the diagram. The phases can have the same crystal structure, but this is not necessary; each phase has the structure of the component with which it borders. No restrictions are imposed on the structure of solid solutions; they can be both substitutional and interstitial solutions.
The figure shows three two-phase areas:L + α, L + β and α + β. Obviously, the areasL + α and L + β are in all senses equivalent to the areaL + α diagrams with unlimited solubility of components, which we discussed in the first part of this article. These areas can be considered as composed of conodes connecting at each given temperature the compositions of the liquid and solid phases, which are represented by the solidus and liquidus lines. Likewise, the α + β region is considered to be composed of conodes connecting at each temperature the composition of the α phase on the α-solubility curve with the corresponding composition of the β phase on the β-solubility curve.
Three two-phase regions are connected to each other by a konode (a - e - b ), common to all of them, and connecting the compositions of three conjugate phases coexisting at the eutectic temperature, that is, α (pointa ), liquids (pointe) and β (point b ). This line is also called a eutectic line or eutectic horizontal, or isothermal reaction. Dote , which is the only liquid that can coexist simultaneously with both solid phases, is called the eutectic point, that is, the point-composition of the alloy with the lowest melting point.
The eutectic transformation that occurs with a solid solution is called eutectoid transformation.
In the third part of the article, we will continue to review the basic phase equilibrium diagrams.
A one-component heterogeneous system is one substance in different states of aggregation or polymorphic modifications. In accordance with the Gibbs phase rule, at K \u003d 1, C \u003d 3 F. Considering that, according to the physical meaning, C 0, it is obvious that F 3, i.e. the number of simultaneously existing phases in a one-component heterogeneous system can be no more than three. In the absence of polymorphism, these are liquid, solid and vapor phases. The two-phase equilibria that are possible in such a system are "liquid - vapor", "solid - vapor" and "solid - liquid". Each of these equilibria is characterized by a certain relationship between the parameters P and T, established by the Clapeyron-Clausius equations for the corresponding processes: evaporation, sublimation and melting.
These relationships can also be established empirically, by methods of physicochemical analysis. They are depicted graphically in the pressure-temperature coordinate axes, in the form of curves P \u003d f (T).
A graphic representation of the states of phase equilibrium at different P and T is called state diagram, or phase diagram... Let us consider as an example the phase diagrams of water and sulfur.
4.5.1. Phase diagram of water
The state of water has been studied in a wide range of temperatures and pressures. It is known that at high pressures ice can be in various crystalline modifications, depending on the physical conditions (P and T). This phenomenon, called polymorphism, is inherent in many other substances. We will consider the diagram of the state of water at low pressures (up to 2000 atm).
The diagram has three phase fields ( fig. 4.1):
AOB field of liquid,
VOS (under the curve) field of unsaturated steam,
AOC is the field of the solid phase.
Figure: 4.1. Phase diagram of water
At any point in the field, the system is single-phase and bivariant (K \u003d 1; Ф \u003d 1; C \u003d 2), i.e. within certain limits, the temperature and pressure can be changed without changing the number of phases and their nature. For example, point 1 corresponds to liquid water, which has parameters t 1 and Р 1.
If there are two phases in equilibrium in the system, then K \u003d 1; Ф \u003d 2; C \u003d 1, i.e. the system is monovariant. This means that one parameter can be changed arbitrarily within certain limits, while the other must change depending on the first. This dependence is expressed by the curve Р \u003d f (Т): ОВ vaporation (or condensation) curve; OScurve of sublimation (or sublimation); AO melting (or solidification) curve. For example, point 2 characterizes an equilibrium system in which water and saturated water vapor are in equilibrium at temperature t 2 and pressure Р 2. If Р 2 \u003d 1 atm, then t 2 is called the normal boiling point.
The evaporation curve of OM water ends at the critical point (B) at t \u003d 374 37C and P \u003d 218 atm. Above this point, liquid and vaporous water are indistinguishable in properties. This was established by D.I. Mendeleev in 1860
The melting curve of AR ice at pressures up to 2047 atm has a left-hand slope, which corresponds to the condition V f.p.< 0 (мольный объем льда > molar volume of water). Such ice is lighter than water, it floats on water, therefore, living organisms are preserved in natural reservoirs that do not freeze to the bottom. At higher pressures, ice transforms into denser modifications, then the AO melting curve is inclined to the right. There are seven known crystalline modifications of ice, of which six have a density higher than that of liquid water. The last of them appears at a pressure of 21680 atm. The transformation of one form of ice into another is an enantiotropic transition (see below for polymorphism).
The dashed curve ОD (continuation of ОВ) characterizes the metastable equilibrium: supercooled water пар saturated steam.
Metastable equilibria are called, at which there are all external signs of phase equilibrium, but the isobaric potential of the system has not reached the minimum absolute value and can decrease further.Water, crystallizing on impurities, turns into ice. Point Triple point. Its coordinates for water in the absence of air: P \u003d 4.579 mm Hg. Art., t \u003d 0.01C. In the presence of air at 1 atm, the three phases are in equilibrium at 0 ° C. In this case, the total pressure is 1 atm, but the partial pressure of water vapor is 4.579 mm Hg. Art. A decrease in the freezing point by 0.01º is caused by two reasons: the solubility of air in water (see the section "Lowering the freezing point of solutions") and the effect of total pressure on the freezing point of liquids (an increase in the total pressure in the system lowers it). This is the only point where all three phases are in equilibrium: water, ice and steam. At this point, the system is invariant: C \u003d 0.
PHASE DIAGRAM, a graphic representation of the conditions (temperature, pressure, chemical composition, etc.), under which in an equilibrium thermodynamic system consisting of one or more specified substances (independent components of the system), there are homogeneous states of matter (phases) with different physicochemical properties. The term “state diagram” is used as equivalent to the term “phase diagram” (mainly in Russia and Germany). However, a state diagram is often called, especially in the English-language literature, graphs that do not directly reflect phase equilibria in the system.
The phases are represented on the phase diagram as regions bounded by curves or surfaces located in the space of independent thermodynamic variables. Usually these are temperature T, pressure P, mole fractions of the components of the system x, functions of these and other variables, such as ratios of quantities or concentrations of components, densities p or molar volumes V m, partial pressures or chemical potentials of substances μ. In the absence of external force fields, the number of coordinate axes of the complete diagram of the phase open system with components is equal to c + 2. To display multidimensional phase diagrams on a plane, their sections and projections are used, constructed under certain constraints imposed on some of the independent variables, often in combination with specially selected coordinate systems (Jenike coordinates, Gibbs - Rosebohm triangles, etc.). The phase diagram shows: which individual substances, liquid, solid or gaseous solutions form the given components of the system; under what conditions are these phases and their heterogeneous mixtures thermodynamically stable; at what values \u200b\u200bof the thermodynamic variables in the system phase transformations of substances occur. Phase diagrams, containing data on the chemical composition of phases, also make it possible to determine the relative amounts of coexisting phases. Such information is necessary for solving many scientific and practical problems and is widely used in chemistry, metallurgy, materials science, geochemistry, and other fields of science and technology.
The coordinates of the phase diagram can be thermodynamic variables of two types - the parameters of thermal, mechanical and chemical equilibria T, P, μ, which have the same values \u200b\u200bin all parts of the equilibrium system, or (usually differing in different phases) generalized densities of extensive properties, such as x, p , V m and other properties equal to the ratios of extensive quantities to the amount, mass or volume of matter in the system. In this regard, three types of phase diagrams are distinguished. Diagrams of the same type are isomorphic: they have the same topological features regardless of the number of components and the values \u200b\u200bof specific variables on the coordinate axes.
On the diagrams of phase types (Т, Р), (Т, μ i), (μ i, μ j) and the like, with intense equilibrium parameters, only phase regions and lines (surfaces) separating them are presented, which denote the stability boundaries of individual phases. The intersection points of the lines correspond to equilibrium conditions for more than two phases. Thus, a triple point on the (T, P) -diagram of a one-component system indicates the conditions for the stable coexistence of three phases.
In the presence of an axis of concentrations, molar properties, densities, as, for example, on the phase diagram (T, x), (P, x), (μ i, x), (T, p), the phase stability regions are separated by other regions, which reflect the existence of heterogeneous mixtures of equilibrium phases. A phase diagram of this type for a two-component system cadmium - zinc is shown in the figure. The diagram of this two-component system has two coordinate axes, and not four, as required by the above expression with + 2, since the condition of constancy of P was used in its construction and two independent variables of the amount of Cd and Zn are replaced by one concentration x Zn (x Cd \u003d 1 - x Zn). The upper part of the figure is a liquid-vapor equilibrium diagram. The broken curve connecting the melting points of the pure components is called the liquidus line; it shows the "melting diagram" of the system. Straight lines (lines) drawn in a heterogeneous region of such a phase diagram between the boundaries of two coexisting phases parallel to the concentration axis (see the eutectic line in the figure), allow for any given component composition of the system to determine the number of coexisting phases ("lever rule").
In the phase diagram of the third type - (x i, x j), (x i, p), (molar entropy, x), (molar enthalpy, x), etc. - the coordinates are only generalized densities of extensive thermodynamic properties. These diagrams also show heterogeneous mixtures of phases and ends, but, unlike the other two types of phase diagrams, in this case the state of heterogeneous mixtures is displayed by a flat or volumetric figure (triangle, tetrahedron) and it is possible to determine the quantitative phase composition of the system at equilibrium of three and more phases (the "rule of the center of gravity" of the figure).
Phase diagrams are studied experimentally and calculated by the methods of chemical thermodynamics from data on the thermodynamic properties of the substances that make up the system. The theoretical foundations for constructing phase diagrams were given by J. Gibbs in the 1880s. He also formulated the "phase rule" (see Gibbs' phase rule), which is widely used in the experimental study of phase equilibria and phase diagrams: at fixed T and P, the number of equilibrium coexisting phases f cannot exceed the number of system components by more than two, f ≤ c + 2.
Lit .: Palatnik L.S., Landau A.I. Phase equilibria in multicomponent systems. Khar., 1961; Kaufman L., Bernstein H. Calculation of state diagrams [of metallic systems] using a computer. M., 1972; Physical metallurgy / Edited by R. Kahn, P. Haazen. M., 1987.Vol. 2.
Real chemicals that you practically have to deal with, and even ultrapure crystals of elementary semiconductors Ge and Si always contain residual impurities, that is, they are always substances consisting of several chemical elements. The interactions of the chemical elements that make up a given material can be very complex. The specific result of this interaction depends on the crystal-chemical nature of the interacting elements, their concentration, as well as on external factors - temperature and pressure.
The main means of displaying the results of the interaction of chemical elements or compounds that form a given substance are system state diagrams. The state diagram shows stable states, that is, states that have a minimum of free energy under given conditions. Therefore, the state diagram can also be called a phase equilibrium diagram, since it shows which equilibrium phases exist under given conditions. Accordingly, the changes in the state of the system, which are reflected in the diagram, refer to equilibrium conditions, that is, in the absence of hypothermia or supersaturation in the system. However, phase transformations cannot occur under equilibrium conditions (see below), so the phase diagram is a theoretical case. Nevertheless, the role of phase diagrams in understanding the nature and results of the interaction of various chemicals and predicting these results is extremely important, because it is the nature of the interaction that determines the properties of the resulting material. In practice, phase diagrams are used to consider transformations at low cooling or heating rates.
State diagramsystem is called a geometric image of equilibrium phase states of one or a multicomponent thermodynamic system as a function of the parameters that determine these states (concentration, temperature, pressure).
Let's define some concepts used in describing state diagrams.
Thermodynamic systemis called a body of macroscopic dimensions (a set of bodies), between the individual parts of which (between
for which) heat transfer and diffusion of at least one of the components of the system is possible and for which (which) the principles of thermodynamics are valid.
Thermodynamic systems are divided into homogeneousand heterogeneous. Homogeneousa thermodynamic system is called, within which there are no interfaces between phases separating parts of the system from each other, which would differ either in crystal structure or in their physical and chemical properties. Heterogeneousthe system consists of parts that have either a different structure or different physical and chemical properties and are separated from each other by interfaces. An example of a heterogeneous system is water,
in equilibrium with steam.
Phaseis a homogeneous system or a system that is a set of homogeneous systems, identical in crystal structure and physicochemical properties, separated from each other by interfaces. In the above example, the phases are water and steam, which differ in density, for example.
Interfaces are layers of finite thickness, in which at least one of the parameters of the system changes in the direction from one phase to another. The interfaces between the phases in relation to the adjacent phases have excess energy (surface tension energy).
For solids, the most important feature of a phase is its crystal lattice.1 Each solid phase has its own crystal lattice inherent only to it, which differs from the lattices of other phases either by type or by parameters. The solid crystalline phase can be obtained in the form of a single crystal or polycrystal, which is a collection of grains or crystallites. Crystallites of a polycrystal differently oriented in space are separated from each other by interfaces in several atomic layers (see Ch. 3). Obviously, the grain boundaries are not interphase boundaries.
Thermodynamic systems can be single or multicomponent.
System componentis called a part of the system, the number of which can vary regardless of the number of other parts. In our case, the components of the system can be chemical elements or compounds. Generally speaking, the number of system components may not be
1In principle, the solid phase can also be amorphous or glassy. Both of these phases are characterized by the absence of long-range order in the arrangement of atoms, rather resembling a liquid. Here we will only consider crystalline materials.

Figure: 4.1. State diagram of the Ge – Si system.
is equal to the number of different chemical elements in the system. For example, water (H2O) is composed of hydrogen and oxygen, but this is a one-component system. In fig. 4.1 and fig. Figure 4.2 shows the phase equilibrium diagrams of two characteristic two-component (binary) semiconductor systems - Ge – Si and InSb – AlSb. In the first case, the components of the system are Ge and Si, and in the second, InSb and AlSb, and not Sb, Al, In, since the amount of In and Al in the system depends on the amount of Sb, and the amount of InSb does not depend on the amount of AlSb. therefore number of system componentsis the minimum number of chemicals required to form any phase of a given system.
The thermodynamically equilibrium state of a system is such a state in which the parameters of this state do not change over time and there are no flows of any type in the system.
The equilibrium state of the system can be single-phase, two-phase and multiphase. When two or more solid phases are mixed, solid solutions, compounds and mechanical mixtures... The latter is realized if these phases do not interact with each other. The phases forming the mixture can be elements, compounds or solid solutions based on them, as well as allotropic modifications of the same chemical element (α and β-tin, etc.). The maximum possible number of phases in equilibrium is determined by the Gibbs phase rule. The phase rule establishes the relationship between

Figure: 4.2. State diagram of the InSb – AlSb system.
by the numbers of phases, components and degrees of freedom of the system:
c= k− f+ 2, (4.1)
where c- the number of degrees of freedom of the system, k- number of system components, fis the number of phases in the system.
Under number of degrees of freedomsystems understand the number of external and internal parameters (temperature, pressure and concentration), which can be changed without changing the number of phases in the system. If the number of degrees of freedom is zero, then the external and internal parameters of the system cannot be changed without causing a change in the number of phases. If the number of degrees of freedom is equal to one, then a change within some limits of one of the parameters is possible and this will not cause a decrease or increase in the number of phases.
For example, consider the case of crystallization of a pure substance (elementary semiconductor) at constant pressure. In this case, Gibbs's rule takes the form c= k− f+ 1.2 When semiconductor
is in a liquid state, that is f\u003d 1, the number of degrees of freedom is 1 ( c= k− f+1 \u003d 1 - 1 + 1 \u003d 1). The temperature in this case can be
change without changing the state of aggregation. At the moment of crystallization
f\u003d 2 (two phases - solid and liquid), c= k− f+1 \u003d 1 - 2 + 1 \u003d 0. This
means that the two phases are in equilibrium at a strictly defined
2 The independent variables in the Gibbs equation are concentration, temperature and pressure. If the pressure is constant, then the number of variables in the equation will decrease by one.
temperature (melting point), and it cannot be changed until one of the phases disappears (a site appears on the temperature-time graph T\u003d const, the length of which will be equal to the time from the beginning to the end of crystallization). In this case, the source of maintaining a constant temperature is the latent heat of crystallizationequal to the difference between the heat contents of the old and new phases. Upon completion of crystallization, only one solid phase remains in the system, that is, the temperature can again change (decrease) without changing the number of phases.
State diagrams depict the phase composition of the system at different concentrations of the components X, temperatures Tand pressure P... State diagrams are generally spatial. The dimension of space depends on the number of independent variables, the function of which is the phase composition. These variables are the coordinates in which the diagram is built. The simplest type of phase diagram characterizes the state of a pure one-component material as a function of pressure and temperature, for example, the well-known diagram of the state of water. However, we will not consider such one-component systems, but immediately proceed to the consideration of multicomponent systems, since it is multicomponent diagrams that are used to obtain semiconductors. Most often, such diagrams are plotted in the temperature-concentration coordinates ( T− X). IN
in this case, for binary (two-component) systems, the diagrams are depicted on a plane. For ternary (three-component) systems, diagrams are built in three-dimensional space, etc. If, in addition to temperature, pressure is also a variable, then for binary systems, diagrams become three-dimensional ( P− T− Xdiagrams). In what follows, we will mainly consider only binary systems constructed in coordinates T− X... However, this chapter will also cover and P− T− Xdiagrams of some semiconductor binary systems, which are of great practical importance.
Typically, the concentration in the diagrams is expressed in weight or mole fractions of one of the components or in atomic percentages. Therefore, the area of \u200b\u200bconcentration change, plotted on the axis X, is limited and extends from zero to one or to 100%. For semiconductor systems, along with diagrams built on a linear scale, diagrams are sometimes built in which the concentration of a component is deposited in atoms per cubic centimeter or in atomic percent, but a logarithmic scale is used. This is due to the fact that, as a rule, the limiting solubility (see Ch. 7)

Figure: 4.3. Phase diagram of the Si – Au system with different scales along the concentration axis (in the region adjacent to the semiconductor, the atomic percentages of the alloying component are plotted on a logarithmic scale, and then the concentration in atomic percentages is plotted on a linear scale).
the content of elements (impurities) in solid state semiconductors is small (less than 0.1 at.%) and the actually used doping in concentration is 1015–1019 atoms / cm3, that is, 10–5–10–2 at.% (see Fig. 4.3 ).
Phase diagrams of state provide information about the nature of the phases and the phase composition of the system when the concentration of one or more components, temperature and pressure changes. Using equilibrium state diagrams for these conditions, it is possible to determine: 1) the number of phases in the system; 2) the composition of each phase, its nature (elementary substance, compound, solid solution) and the conditions under which it is formed; 3) the relative amount of each of the phases.
Phase diagrams are built on the basis of physical and chemical analysis data. This analysis is based on the experimental study of the dependences of physical properties on parameters such as concentration, temperature, pressure. Knowledge of these dependencies allows one to establish the nature of the phases and the boundaries of their existence. The most common methods used for plotting state diagrams are thermographic and dilatometric methods. Their essence lies in the fact that for an alloy of a given composition, the temperatures of phase transformations are determined by a jump-like change in enthalpy H(heat content) or volume Vsystem, fixed on the curves temperature-time (temperature is noted at regular intervals) or temperature-volume in the process of cooling or heating the alloy. Having thus determined the points of phase transformations for alloys of different compositions of a given system, it is possible to construct the entire phase diagram. These methods determine only phase transformations of the first kind. These transitions should be distinguished from second-order phase transformations (ferromagnetic – paramagnetic state, superconducting – non-superconducting, ordered – disordered), accompanied by a jump-like change in the compressibility coefficient and specific heat. In this case, the composition-property diagrams are built or, for a given composition, the temperature-property diagram, etc.