In practice, it is more often necessary to solve the opposite problem in relation to the one discussed above - the decomposition of a certain signal into its constituent harmonic oscillations. In a course of mathematical analysis, a similar problem is traditionally solved by expanding a given function into a Fourier series, i.e., into a series of the form:
Where i
=1,2,3….
A practical Fourier series expansion called harmonic analysis
, consists in finding the quantities a 1
,a 2
,…,a i ,
b
1
,b
2
,…,b
i
,
called Fourier coefficients. Based on the value of these coefficients, one can judge the share in the studied function of harmonic oscillations of the corresponding frequency, a multiple of ω
. Frequency ω
is called the fundamental or carrier frequency, and the frequencies 2ω, 3ω,…i·ω
– respectively 2nd harmonic, 3rd harmonic, i
th harmonic. The use of mathematical analysis methods makes it possible to expand most functions that describe real physical processes into Fourier series. The use of this powerful mathematical apparatus is possible under the condition of an analytical description of the function under study, which is an independent and often not a simple task.
The task of harmonic analysis can be formulated as a search in a real signal for the presence of a particular frequency. For example, there are methods for determining the rotation speed of a turbocharger rotor based on an analysis of the sound accompanying its operation. The characteristic whistle heard when a turbocharged engine is running is caused by air vibrations due to the movement of the compressor impeller blades. The frequency of this sound and the speed of rotation of the impeller are proportional. When using analog measuring equipment in these cases, they proceed something like this: simultaneously with the reproduction of the recorded signal, oscillations of a known frequency are created using a generator, moving them through the range under study until resonance occurs. The frequency of the generator corresponding to the resonance will be equal to the frequency of the signal under study.
The introduction of digital technology into measurement practice makes it possible to solve such problems using calculation methods. Before considering the main ideas inherent in these calculations, we will show the distinctive features of the digital representation of the signal.
Discrete methods of harmonic analysis

Rice. 18. Quantization by amplitude and time
A
– original signal; b
– quantization result;
V
,
G
– saved data
When using digital equipment, a real continuous signal (Fig. 18, A) is represented by a set of points, or more precisely by the values of their coordinates. To do this, the original signal, coming, for example, from a microphone or accelerometer, is quantized in time and amplitude (Fig. 18, b). In other words, the measurement and storage of the signal value occurs discretely after a certain time interval Δt
, and the value itself at the time of measurement is rounded to the nearest possible value. Time Δt
called time
sampling
, which is inversely related to the sampling frequency.
The number of intervals into which the double amplitude of the maximum permissible signal is divided is determined by the bit capacity of the equipment. It is obvious that for digital electronics, which ultimately operates with Boolean values (“one” or “zero”), all possible bit depth values will be determined as 2
n. When we say that the sound card of our computer is 16-bit, this means that the entire permissible interval of the input voltage value (the y-axis in Fig. 11) will be divided into 2
16
=
65536
equal intervals.
As can be seen from the figure, with a digital method of measuring and storing data, some of the original information will be lost. To increase the accuracy of measurements, the bit depth and sampling frequency of the converting equipment should be increased.
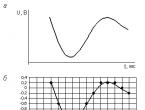
Let's return to the task at hand - determining the presence of a certain frequency in an arbitrary signal. For greater clarity of the techniques used, consider a signal that is the sum of two harmonic oscillations: q=sin
2t
+sin
5t
, specified with discreteness Δt=0.2(Fig. 19). The table in the figure shows the values of the resulting function, which we will further consider as an example of some arbitrary signal.
 Rice. 19. Signal under study
To check the presence of the frequency of interest to us in the signal under study, we multiply the original function by the dependence of the change in the vibrational value at the frequency being tested. Then we add (numerically integrate) the resulting function. We will multiply and sum signals over a certain interval - the period of the carrier (fundamental) frequency. When choosing the value of the fundamental frequency, it must be borne in mind that it is possible to check only a greater one in relation to the fundamental one, in n times the frequency. Let's choose as the main frequency ω
=1, which corresponds to the period.
Let's start the test immediately with the “correct” (present in the signal) frequency y
n
=sin2x. In Fig. 20 the actions described above are presented graphically and numerically. It should be noted that the result of the multiplication passes mainly above the x-axis, and therefore the sum is noticeably greater than zero (15.704>0). A similar result would be obtained by multiplying the original signal by q n =sin5t(the fifth harmonic is also present in the signal under study). Moreover, the greater the amplitude of the tested signal in the test signal, the greater the result of calculating the sum.

Rice. 20. Checking the presence of a component in the signal under study
q
n
= sin2t
Now let's perform the same actions for a frequency that is not present in the signal under study, for example, for the third harmonic (Fig. 21).

Rice. 21. Checking the presence of a component in the signal under study
q
n
=sin3t
In this case, the curve of the multiplication result (Fig. 21) passes both in the region of positive and negative amplitudes. Numerical integration of this function will give a result close to zero ( ∑
=-0.006), which indicates the absence of this frequency in the signal under study or, in other words, the amplitude of the harmonic under study is close to zero. Theoretically we should have gotten zero. The error is caused by limitations of discrete methods due to the finite bit depth and sampling frequency. By repeating the steps described above the required number of times, you can find out the presence and level of a signal of any frequency that is a multiple of the carrier.
Without going into details, we can say that approximately the same actions are performed in the case of the so-called discrete Fourier transform
.
In the example considered, for greater clarity and simplicity, all signals had the same (zero) initial phase shift. To take into account possible different initial phase angles, the actions described above are performed with complex numbers.
There are many known discrete Fourier transform algorithms. The result of the transformation - the spectrum - is often presented not as a line, but as a continuous one. In Fig. Figure 22 shows both variants of the spectra for the signal studied in the example considered.

Rice. 22. Spectrum options
Indeed, if in the example considered above we had performed the test not only for frequencies strictly multiple of the fundamental one, but also in the vicinity of multiple frequencies, we would have found that the method shows the presence of these harmonic oscillations with an amplitude greater than zero. The use of a continuous spectrum in signal research is also justified by the fact that the choice of the fundamental frequency in research is largely random.
Using sets of acoustic resonators, you can establish which tones are part of a given sound and with what amplitudes they are present in this sound. This establishment of the harmonic spectrum of a complex sound is called its harmonic analysis. Previously, such an analysis was actually carried out using sets of resonators, in particular Helmholtz resonators, which are hollow spheres of different sizes, equipped with a process inserted into the ear, and having an opening on the opposite side (Fig. 43). The action of such a resonator, as well as the action of the resonant box of a tuning fork, we will explain below (§51). For sound analysis, it is essential that whenever the analyzed sound contains a tone with the frequency of the resonator, the latter begins to sound loudly in this tone.
Rice. 43. Helmholtz resonator
Such methods of analysis, however, are very imprecise and laborious. Currently, they are being replaced by much more advanced, accurate and fast electro-acoustic methods. Their essence boils down to the fact that an acoustic vibration is first converted into an electrical vibration, maintaining the same shape, and therefore having the same spectrum (§ 17); then this electrical oscillation is analyzed by electrical methods.
Let us indicate one significant result of harmonic analysis concerning the sounds of our speech. We can recognize a person's voice by timbre. But how do sound vibrations differ when the same person sings different vowels on the same note: a, i, o, u, e? In other words, how do the periodic vibrations of air caused by the vocal apparatus differ in these cases with different positions of the lips and tongue and changes in the shape of the mouth and throat? Obviously, in the vowel spectra there must be some features characteristic of each vowel sound, in addition to those features that create the timbre of a given person's voice. Harmonic analysis of vowels confirms this assumption, namely, vowel sounds are characterized by the presence in their spectra of overtone areas with large amplitude, and these areas always lie at the same frequencies for each vowel, regardless of the height of the sung vowel sound. These regions of strong overtones are called formants. Each vowel has two formants characteristic of it. In Fig. 44 shows the position of the formants of the vowels u, o, a, e, i.
Obviously, if we artificially reproduce the spectrum of a particular sound, in particular the spectrum of a vowel, then our ear will receive the impression of this sound, even if its “natural source” is absent. It is especially easy to carry out such synthesis of sounds (and synthesis of vowels) using electroacoustic devices. Electric musical instruments make it very easy to change the spectrum of sound, i.e. change its timbre.
GIA text assignments Task No. FF157A Hydrometer– a device for measuring the density of liquids, the operating principle of which is based on Archimedes’ law. Usually it is a glass tube, the lower part of which, during calibration, is filled with shot to achieve the required mass (Fig. 1). In the upper, narrow part there is a scale, which is graduated in values of solution density. The density of the solution is equal to the ratio of the mass of the hydrometer to the volume by which it is immersed in the liquid. Since the density of liquids strongly depends on temperature, density measurements must be carried out at a strictly defined temperature, for which the hydrometer is sometimes equipped with a thermometer.
Using text and pictures, choose from the list provided two
true statements. Indicate their numbers.
1) According to fig. 2, the density of the liquid in the second beaker is greater than the density of the liquid in the first beaker.
2) The hydrometer is designed to measure the density of only those liquids whose density is greater than the average density of the hydrometer.
3) When the liquid is heated, the depth of immersion of the hydrometer into it does not change.
4) The depth of immersion of a hydrometer into a given liquid does not depend on the amount of shot in it.
5) The buoyancy force acting on the hydrometer in liquid (1) is equal to the buoyancy force acting on the hydrometer in liquid (2).
Task №fad1e8 The figure shows the profile of the wave.

The wavelength and amplitude are equal respectively
1) 12 cm and 9 cm
2) 18 cm and 6 cm
3) 12 cm and 18 cm
4) 18 cm and 12 cm
Sound Analysis
Previously, sound analysis was performed using resonators, which are hollow balls of different sizes with an open extension inserted into the ear and a hole on the opposite side. For sound analysis, it is essential that whenever the analyzed sound contains a tone whose frequency is equal to the frequency of the resonator, the latter begins to sound loudly in this tone.
Such methods of analysis, however, are very imprecise and laborious. Currently, they are being replaced by much more advanced, accurate and fast electroacoustic methods. Their essence boils down to the fact that an acoustic vibration is first converted into an electrical vibration, maintaining the same shape, and, therefore, having the same spectrum, and then this vibration is analyzed by electrical methods.
One of the significant results of harmonic analysis concerns the sounds of our speech. We can recognize a person's voice by timbre. But how do sound vibrations differ when the same person sings different vowels on the same note? In other words, how do the periodic vibrations of air caused by the vocal apparatus differ in these cases with different positions of the lips and tongue and changes in the shape of the oral cavity and pharynx?
Obviously, in the vowel spectra there must be some features characteristic of each vowel sound, in addition to those features that create the timbre of a given person's voice. Harmonic analysis of vowels confirms this assumption, namely, vowel sounds are characterized by the presence in their spectra of overtone areas with large amplitude, and these areas always lie at the same frequencies for each vowel, regardless of the height of the sung vowel sound.
What determines the characteristics of different vowel sounds?
The correct answer is
1) only A
2) only B
3) both A and B
4) neither A nor B
Task No. 27CDDB
What is meant by harmonic analysis of sound?
1) setting the sound volume
2) establishing the frequencies and amplitudes of the tones that make up a complex sound
3) establishing the possibility of singing different vowel sounds on the same note
4) establishing the height of a complex sound
Task No. C2AE03
What physical phenomenon underlies the analysis of sound using hollow spheres?
1) resonance
2) electrical vibrations
3) reflection of sound from the appendage of the ball
4) transformation of sound vibrations into electrical ones
Sound Analysis
Using sets of acoustic resonators, you can determine which tones are part of a given sound and what their amplitudes are. This determination of the spectrum of a complex sound is called its harmonic analysis. Previously, sound analysis was performed using resonators, which are hollow balls of different sizes with an open extension inserted into the ear and a hole on the opposite side. For sound analysis, it is essential that whenever the analyzed sound contains a tone whose frequency is equal to the frequency of the resonator, the latter begins to sound loudly in this tone.
Such methods of analysis, however, are very imprecise and laborious. Currently, they are being replaced by much more advanced, accurate and fast electroacoustic methods. Their essence boils down to the fact that an acoustic vibration is first converted into an electrical vibration, maintaining the same shape, and, therefore, having the same spectrum, and then this vibration is analyzed by electrical methods.
One of the significant results of harmonic analysis concerns the sounds of our speech. We can recognize a person's voice by timbre. But how do sound vibrations differ when the same person sings different vowels on the same note? In other words, how do the periodic vibrations of air caused by the vocal apparatus differ in these cases with different positions of the lips and tongue and changes in the shape of the oral cavity and pharynx? Obviously, in the vowel spectra there must be some features characteristic of each vowel sound, in addition to those features that create the timbre of a given person's voice. Harmonic analysis of vowels confirms this assumption, namely: vowel sounds are characterized by the presence in their spectra of overtone areas with large amplitude, and these areas always lie at the same frequencies for each vowel, regardless of the height of the sung vowel sound.
Harmonic analysis of sound is called A. establishing the number of tones that make up a complex sound.
B. establishing the frequencies and amplitudes of the tones that make up a complex sound.
Correct answer
1) only A
2) only B
3) both A and B
4) neither A nor B
Task No. 439A8F
Is it possible, using the spectrum of sound vibrations, to distinguish one vowel sound from another? Explain your answer. What physical phenomenon underlies the electroacoustic method of sound analysis?
1) conversion of electrical vibrations into sound
2) decomposition of sound vibrations into a spectrum
3) resonance
4) conversion of sound vibrations into electrical ones
Flotation
One of the methods of ore beneficiation, based on the wetting phenomenon, is flotation. The essence of flotation is as follows. The ore crushed into a fine powder is shaken in water. A small amount of a substance is added there that has the ability to wet one of the parts to be separated, for example grains of a mineral, and not wet the other part - grains of waste rock. In addition, the added substance must not dissolve in water. In this case, water will not wet the surface of the ore grain covered with a layer of additive. Usually some kind of oil is used. As a result of mixing, grains of minerals are enveloped in a thin film of oil, while grains of waste rock remain free. Air is blown into the resulting mixture in very small portions. Air bubbles that come into contact with a grain of useful rock, coated with a layer of oil and therefore not wetted by water, stick to it. This happens because the thin film of water between the air bubbles and the surface of the grain that is not wetted by it tends to reduce its area, like a drop of water on oiled paper, and exposes the surface of the grain.
What is flotation?
1) a method of ore enrichment, which is based on the phenomenon of floating bodies
2) floating of bodies in liquid
3) a method of ore enrichment, which is based on the phenomena of wetting and floating
4) method of obtaining minerals
Task No. 6F39A2
Why do grains of useful ore rise up from a mixture of water and ore?
1) the grains are subject to a buoyancy force that is less than the force of gravity acting on the grains
bubbles adhering to them are subject to a buoyancy force that is less than the force of gravity acting on the grains
3) the grains and bubbles adhered to them are subject to a buoyancy force equal to the force of gravity acting on the grains
4) they are affected by the surface tension force of the water layer between the oil film and the air bubble
Flotation
Pure ore is almost never found in nature. Almost always the mineral is mixed with “empty”, unnecessary rock. The process of separating waste rock from minerals is called ore beneficiation. One of the methods of ore beneficiation, based on the wetting phenomenon, is flotation. The essence of flotation is as follows. The ore crushed into a fine powder is shaken in water. A small amount of a substance is added there that has the ability to wet one of the parts to be separated, for example grains of a mineral, and not wet the other part - grains of waste rock. In addition, the added substance must not dissolve in water. In this case, water will not wet the surface of the ore grain covered with a layer of additive. Usually some kind of oil is used. As a result of mixing, grains of minerals are enveloped in a thin film of oil, while grains of waste rock remain free. Air is blown into the resulting mixture in very small portions. Air bubbles that come into contact with a grain of useful rock, coated with a layer of oil and therefore not wetted by water, stick to it. This happens because the thin film of water between the air bubbles and the surface of the grain that is not wetted by it tends to reduce its area, like a drop of water on oiled paper, and exposes the surface of the grain.
Grains of useful ore with air bubbles rise up, and grains of waste rock fall down. In this way, more or less complete separation of the waste rock occurs and a concentrate rich in useful ore is obtained. Task No. 866BE9
Is it possible, using flotation, to make the waste rock float to the top and the ore grains to settle to the bottom? Explain your answer.
Let's take a piece of sugar in our hands and touch it to the surface of the boiling water. The boiling water will be drawn into the sugar and reach our fingers. However, we will not feel the burn as we would if there was a piece of cotton wool instead of sugar. This observation shows that the dissolution of sugar is accompanied by cooling of the solution. If we wanted to keep the temperature of the solution constant, we would have to supply energy to the solution. It follows that when sugar dissolves, the internal energy of the sugar-water system increases. The same thing happens when most other crystalline substances dissolve. In all such cases, the internal energy of the solution is greater than the internal energy of the crystal and the solvent at the same temperature, taken separately.
In the example with sugar, the amount of heat required to dissolve it is given off by boiling water, the cooling of which is noticeable even by direct sensation.
If dissolution occurs in water at room temperature, then the temperature of the resulting mixture in some cases may even be below 0 ° C, although the mixture remains liquid, since the pour point of the solution can be significantly lower than 0 ° C. This effect is used to produce highly cooled mixtures of snow and various salts.
Snow, starting to melt at 0 ° C, turns into water in which salt dissolves; despite the drop in temperature that accompanies dissolution, the resulting mixture does not harden. Snow mixed with this solution continues to melt, taking energy from the solution and, accordingly, cooling it. The process can continue until the freezing temperature of the resulting solution is reached. A mixture of snow and table salt in a ratio of 2:1 thus allows cooling to −21 ° C; a mixture of snow with calcium chloride (CaCl 2) in a ratio of 7:10 allows cooling to −50 ° C. Task No. 17A777
Where will your feet get colder: on a snow-covered sidewalk or on the same sidewalk sprinkled with salt?
1) on a snowy sidewalk
2) on the sidewalk sprinkled with salt
3) the same on a snowy sidewalk and on a sidewalk sprinkled with salt
4) the answer depends on the ambient temperature
Noise and human health
Modern noise discomfort causes painful reactions in living organisms. Transport or industrial noise has a depressing effect on a person - it tires, irritates, and interferes with concentration. As soon as such noise stops, a person experiences a feeling of relief and peace.
A noise level of 20–30 decibels (dB) is practically harmless to humans. This is a natural background noise, without which human life is impossible. For “loud sounds” the maximum permissible limit is approximately 80–90 decibels. A sound of 120–130 decibels already causes pain in a person, and at 150 it becomes unbearable for him. The effect of noise on the body depends on age, hearing sensitivity, and duration of action.
Long periods of continuous exposure to high-intensity noise are most harmful to hearing. After exposure to strong noise, the normal threshold of auditory perception noticeably increases, that is, the lowest level (loudness) at which a given person can still hear a sound of a particular frequency. Measurements of auditory perception thresholds are carried out in specially equipped rooms with a very low level of ambient noise, using sound signals through headphones. This technique is called audiometry; it allows you to obtain a curve of individual hearing sensitivity, or audiogram. Typically, audiograms show deviations from normal hearing sensitivity (see figure).

Audiogram of typical hearing threshold shift after short-term noise exposure
The hearing threshold is defined as
1) minimum sound frequency perceived by humans
2) the maximum frequency of sound perceived by a person
3) the highest level at which a sound of a particular frequency does not lead to hearing loss
4) the lowest level at which a given person can still hear a sound of a particular frequency
Task No. 29840A
Which statements made on the basis of the audiogram (see figure) are true? A. The maximum shift in the hearing threshold corresponds to low frequencies (up to approximately 1000 Hz). B. Maximum hearing loss corresponds to a frequency of 4000 Hz.
1) only A
2) only B
3) both A and B
4) neither A nor B
Task No. 79F950
Determine which noise sources shown in the table create unacceptable noise levels.
1) B
2) C and B
3) C, B and D
4) B, B, D and A
Seismic waves
During an earthquake or major explosion, mechanical waves called seismic waves arise in the crust and thickness of the Earth. These waves propagate in the Earth and can be recorded using special instruments - seismographs.
The operation of a seismograph is based on the principle that the load of a freely suspended pendulum during an earthquake remains practically motionless relative to the Earth. The figure shows a diagram of a seismograph. The pendulum is suspended from a stand firmly fixed in the ground and connected to a pen that draws a continuous line on the paper tape of a uniformly rotating drum. When the soil vibrates, the stand with the drum also begins to oscillate, and a graph of wave motion appears on paper.
There are several types of seismic waves, of which the longitudinal wave is the most important for studying the internal structure of the Earth P and shear wave S. A longitudinal wave is characterized by the fact that particle vibrations occur in the direction of wave propagation; These waves arise in solids, liquids, and gases. Transverse mechanical waves do not propagate in either liquids or gases. The speed of propagation of a longitudinal wave is approximately 2 times higher than the speed of propagation of a transverse wave and amounts to several kilometers per second. When the waves P And S pass through a medium whose density and composition change, the speeds of the waves also change, which is manifested in the refraction of the waves. In denser layers of the Earth, wave speed increases. The nature of the refraction of seismic waves allows us to study the internal structure of the Earth.
The figure shows graphs of the dependence of the velocities of seismic waves on the depth of immersion in the bowels of the Earth. Graph for which of the waves ( P or S) indicates that the Earth's core is not in a solid state? Justify your answer.
Which statement(s) is true? A. During an earthquake, the weight of the seismograph pendulum oscillates relative to the surface of the Earth.
B. A seismograph installed at some distance from the epicenter of the earthquake will first record a seismic wave P and then a wave S.
1) only A
2) only B
3) both A and B
4) neither A nor B
Task No. 9815BE
Seismic wave P is
1) mechanical longitudinal wave
2) mechanical transverse wave
3) radio wave
4) light wave
Sound recording
The ability to record sounds and then play them back was discovered in 1877 by the American inventor T.A. Edison. Thanks to the ability to record and play back sounds, sound cinema appeared. Recording pieces of music, stories, and even entire plays on gramophone or gramophone records became a popular form of sound recording. Figure 1 shows a simplified diagram of a mechanical sound recording device. Sound waves from a source (singer, orchestra, etc.) enter horn 1, in which a thin elastic plate 2, called a membrane, is fixed. Under the influence of a sound wave, the membrane vibrates. The vibrations of the membrane are transmitted to the cutter 3 associated with it, the tip of which draws a sound groove on the rotating disk 4. The sound groove twists in a spiral from the edge of the disk to its center. The figure shows the appearance of sound grooves on a record viewed through a magnifying glass.

The disc on which the sound is recorded is made of a special soft wax material. A copper copy (cliché) is removed from this wax disk using a galvanoplastic method. This involves the deposition of pure copper on an electrode when an electric current passes through a solution of its salts. The copper copy is then imprinted onto plastic disks. This is how gramophone records are made.
When playing sound, a gramophone record is placed under a needle connected to the gramophone membrane, and the record is rotated. Moving along the wavy groove of the record, the end of the needle vibrates, and the membrane vibrates along with it, and these vibrations quite accurately reproduce the recorded sound.
Task No. 5848B0 When recording sound mechanically, a tuning fork is used. By increasing the playing time of the tuning fork by 2 times
|
If you press the pedal of a piano and shout hard at it, you can hear an echo from it, which will be heard for some time, with a tone (frequency) very similar to the original sound.
Sound analysis and synthesis.
Using sets of acoustic resonators, you can establish which tones are part of a given sound and with what amplitudes they are present in this sound. This establishment of the harmonic spectrum of a complex sound is called its harmonic analysis. Previously, such an analysis was actually carried out using sets of resonators, in particular Helmholtz resonators, which are hollow spheres of different sizes, equipped with an extension that is inserted into the ear, and having an opening on the opposite side.
For sound analysis, it is essential that whenever the sound being analyzed contains a tone with the frequency of the resonator, the resonator begins to sound loudly at this tone.
Such methods of analysis are very inaccurate and laborious. Currently, they are being replaced by much more advanced, accurate and fast electro-acoustic methods. Their essence boils down to the fact that an acoustic vibration is first converted into an electrical vibration, maintaining the same shape, and therefore having the same spectrum; then the electrical vibration is analyzed using electrical methods.
One significant result of harmonic analysis can be pointed out regarding the sounds of our speech. We can recognize a person's voice by timbre. But how do sound vibrations differ when the same person sings different vowels on the same note: a, i, o, u, e? In other words, how do the periodic vibrations of air caused by the vocal apparatus differ in these cases with different positions of the lips and tongue and changes in the shape of the oral cavities and throat? Obviously, in the vowel spectra there must be some features characteristic of each vowel sound, in addition to those features that create the timbre of a given person's voice. Harmonic analysis of vowels confirms this assumption, namely, vowel sounds are characterized by the presence in their spectra of overtone areas with large amplitude, and these areas always lie at the same frequencies for each vowel, regardless of the height of the sung vowel sound. These regions of strong overtones are called formants. Each vowel has two formants characteristic of it.
Obviously, if we artificially reproduce the spectrum of a particular sound, in particular the spectrum of a vowel, then our ear will receive the impression of this sound, although its natural source would be absent. It is especially easy to carry out such synthesis of sounds (and synthesis of vowels) using electroacoustic devices. Electric musical instruments make it very easy to change the spectrum of sound, i.e. change its timbre. A simple switch makes the sound similar to the sounds of a flute, a violin, or a human voice, or completely unique, unlike the sound of any ordinary instrument.
Doppler effect in acoustics.
The frequency of sound vibrations heard by a stationary observer when the sound source approaches or moves away from him is different from the sound frequency perceived by an observer who moves with this sound source, or both the observer and the sound source are standing still. The change in sound frequency (pitch) associated with the relative motion of the source and observer is called the acoustic Doppler effect. When the source and receiver of sound come closer, the pitch of the sound increases, and if they move away. then the pitch of the sound decreases. This is due to the fact that when a sound source moves relative to the medium in which sound waves propagate, the speed of such movement is added vectorially to the speed of sound propagation.
For example, if a car with a siren on is approaching, and then, having passed by, moves away, then a high-pitched sound is heard first, and then a low-pitched one.
Sonic booms
Shock waves occur during a shot, explosion, electrical discharge, etc. The main feature of a shock wave is a sharp jump in pressure at the wave front. At the moment of passage of the shock wave, the maximum pressure at a given point occurs almost instantly in a time of the order of 10-10 s. At the same time, the density and temperature of the medium change abruptly. Then the pressure slowly drops. The power of the shock wave depends on the force of the explosion. The speed of propagation of shock waves can be greater than the speed of sound in a given medium. If, for example, a shock wave increases the pressure by one and a half times, then the temperature rises by 35 0C and the speed of propagation of the front of such a wave is approximately 400 m/s. Walls of medium thickness that meet in the path of such a shock wave will be destroyed.
Powerful explosions will be accompanied by shock waves, which create a pressure 10 times higher than atmospheric pressure at the maximum phase of the wave front. In this case, the density of the medium increases 4 times, the temperature rises by 500 0C, and the speed of propagation of such a wave is close to 1 km/s. The thickness of the shock wave front is of the order of the free path of molecules (10-7 - 10-8 m), therefore, upon theoretical consideration, we can assume that the shock wave front is an explosion surface, upon passing through which the gas parameters change abruptly.
Shock waves also occur when a solid body moves at a speed exceeding the speed of sound. A shock wave is formed in front of an aircraft that flies at supersonic speed, which is the main factor determining the resistance to the movement of the aircraft. To reduce this resistance, supersonic aircraft are given an arrow-shaped shape.
Rapid compression of air in front of an object moving at high speed leads to an increase in temperature, which increases with increasing speed of the object. When the plane reaches the speed of sound, the air temperature reaches 60 0C. At a speed twice as high as the speed of sound, the temperature rises by 240 0C, and at a speed close to triple the speed of sound, it becomes 800 0C. Velocities close to 10 km/s lead to melting and transformation of a moving body into a gaseous state. The fall of meteorites at a speed of several tens of kilometers per second leads to the fact that already at an altitude of 150 - 200 kilometers, even in a rarefied atmosphere, meteorite bodies noticeably heat up and glow. Most of them completely disintegrate at altitudes of 100 - 60 kilometers.
Noises.
The superposition of a large number of oscillations, randomly mixed with respect to one another and randomly changing intensity over time, leads to a complex form of oscillations. Such complex vibrations, consisting of a large number of simple sounds of different tones, are called noise. Examples include the rustling of leaves in the forest, the roar of a waterfall, the noise on a city street. Noises can also include sounds expressed by consonants. Noises may differ in distribution in terms of sound intensity, frequency and duration of sound over time. Noises created by the wind, falling water, and sea surf can be heard for a long time. The rumble of thunder and the roar of waves are relatively short-lived and are low-frequency noises. Mechanical noise can be caused by vibration of solids. The sounds that arise when bubbles and cavities burst in a liquid, which accompany the processes of cavitation, lead to cavitation noise.